


 Back to list
During qPCR, many friends may not quite understand what terms such as amplification curve, CT value, baseline, threshold line, and melting curve mean. So today let us take a look at those maddening curves in the PCR process.
Amplification curve:During the fluorescence quantitative PCR experiment, the fluorescence quantitative PCR instrument monitors the entire PCR amplification process in real time and records the fluorescence signal. As the number of reaction cycles increases, the recorded fluorescence signal also continuously accumulates.
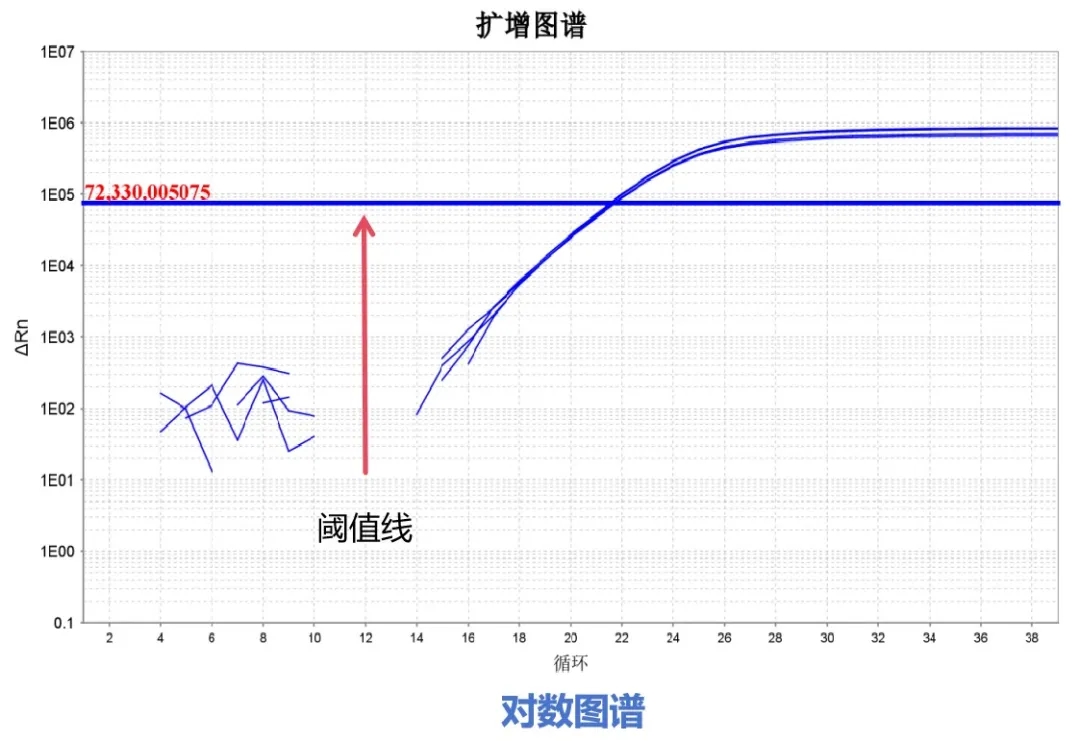
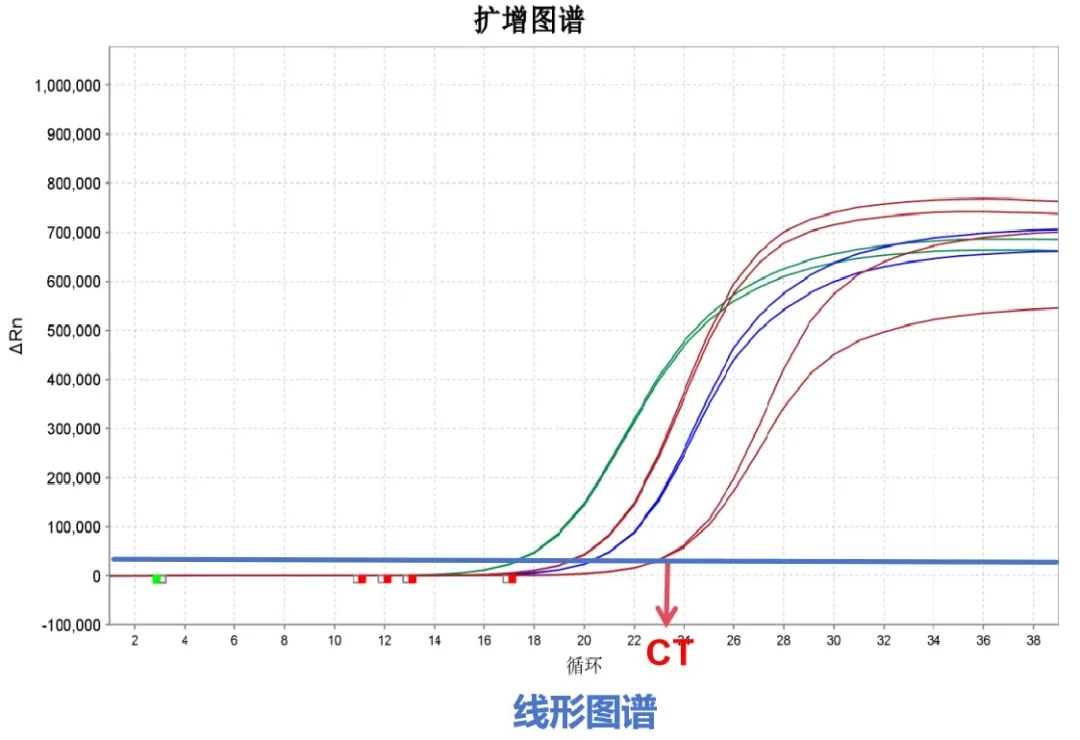
The amplification curve is the curve that describes the dynamic process of PCR, with the number of cycles as the horizontal coordinate and the real-time fluorescence signal intensity during the reaction as the vertical coordinate. The fluorescence quantitative PCR amplification curves usually seen have two presentation forms, namely the logarithmic graph and the linear graph.


A typical amplification curve can be divided into four phases: baseline phase, exponential phase, linear phase, and plateau phase.
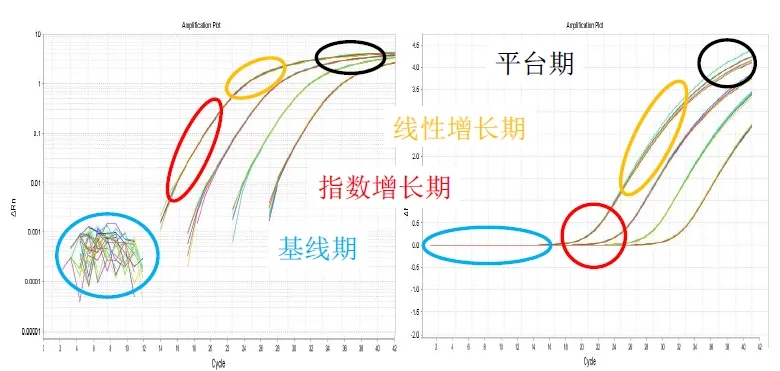
Baseline phase:In the horizontal part of the amplification curve, the amplified fluorescence signal is masked by the fluorescence background signal, making it impossible to determine changes in the amount of product generated.
Exponential phase:In the exponential amplification of PCR, "one becomes two, two becomes four, four becomes eight," and the amplification curve begins to rise. During this phase, all reaction reagents are in excess, DNA polymerase still maintains a high level of activity, and the amount of product in each cycle has an exponential relationship with the initial template amount. There is a linear relationship between the logarithm of the PCR product amount and the initial template amount, so this phase is most suitable for quantitative analysis.
Linear phase:With the consumption of raw materials, accumulation of products, and loss of enzyme activity, DNA amplification no longer shows exponential amplification, the growth of the fluorescence signal gradually slows down, reaction efficiency decreases, and the product amount no longer has an exponential relationship with the initial template amount.
Plateauphase:Due to factors such as substrate exhaustion and decreased enzyme activity, the fluorescence signal no longer increases and tends to level off. Because the factors affecting PCR amplification are complex and varied, the time at which each reaction enters the plateau phase and the height of the plateau phase are all different.
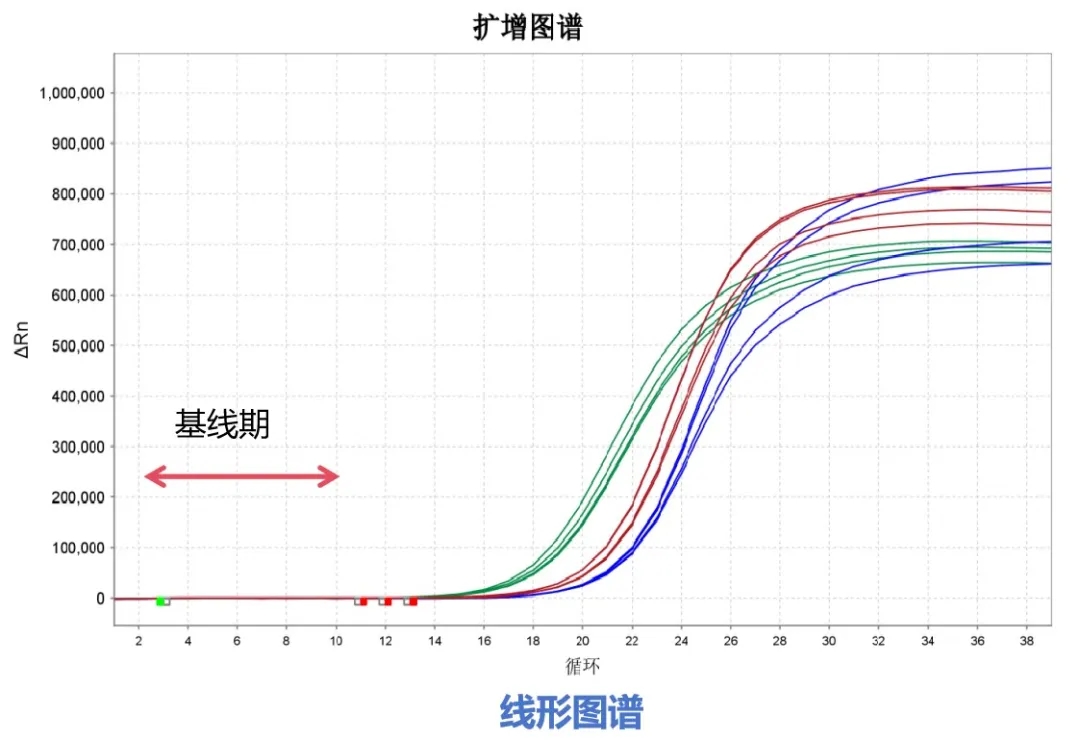
Baseline:The baseline is the background signal of the first few cycles of PCR, showing a straight-line form with small fluctuations. At this time, the software can automatically calculate a reasonable baseline range.

Threshold line:The threshold is a value artificially set on the fluorescence amplification curve. It can be set at any position during the exponential amplification phase of the fluorescence signal. Generally, the fluorescence threshold is set at 10 times the standard deviation of the baseline (background) fluorescence signal. The fluorescence threshold is set during the exponential growth phase of PCR.
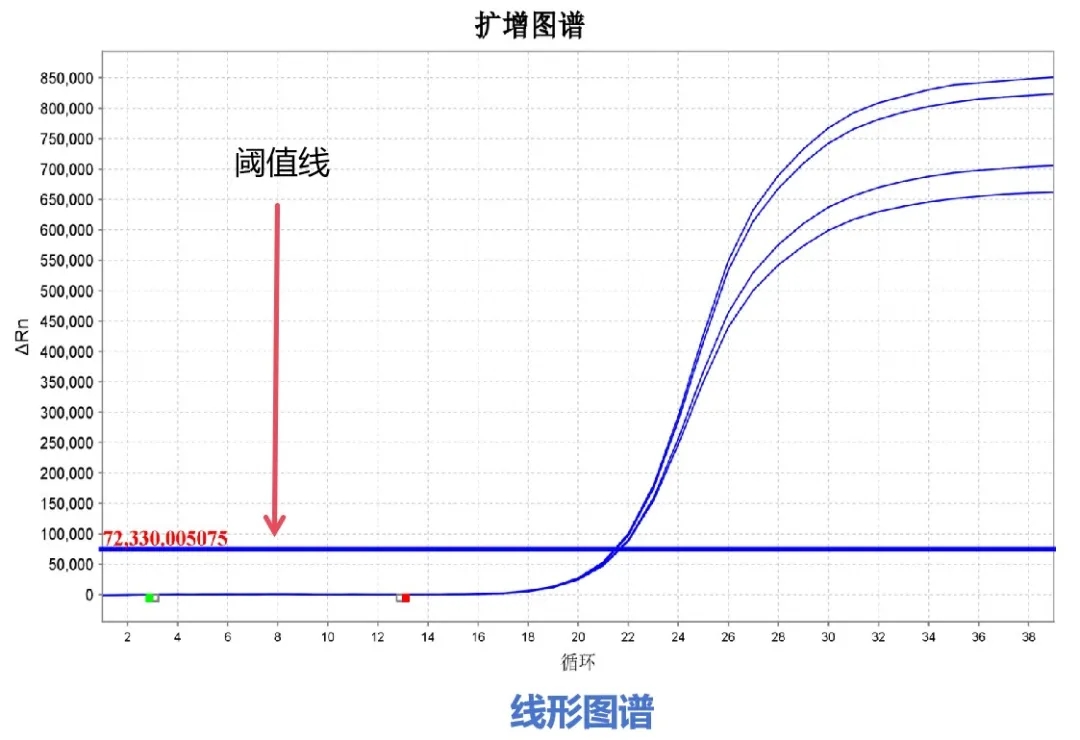
CT value:The number of cycles experienced when the fluorescence signal in each reaction tube reaches the set threshold is called the CT value.

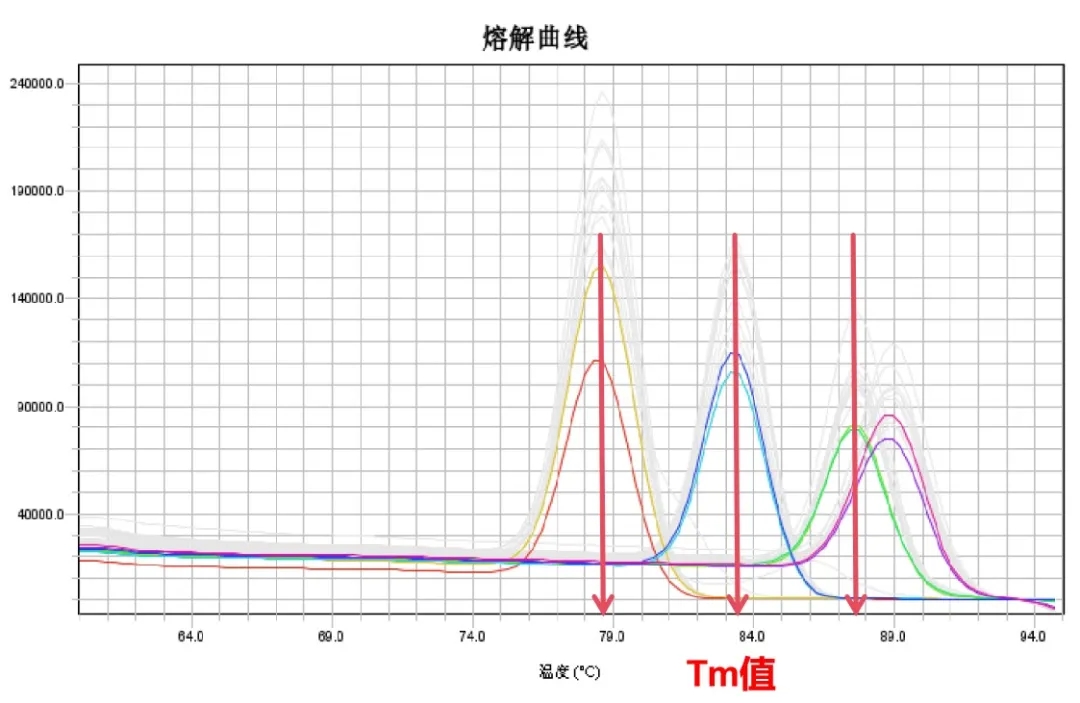
Melting curve and Tm value:The dissociation curve refers to the curve of the degree of degradation of the DNA double helix structure as the temperature increases; the temperature at which half of the total DNA double helix structure is degraded is called the melting temperature (Tm). Different PCR products have different corresponding Tm values due to differences in GC content, fragment size, and salt ion concentration. Therefore, the Tm value can be used to verify the specificity of PCR products.
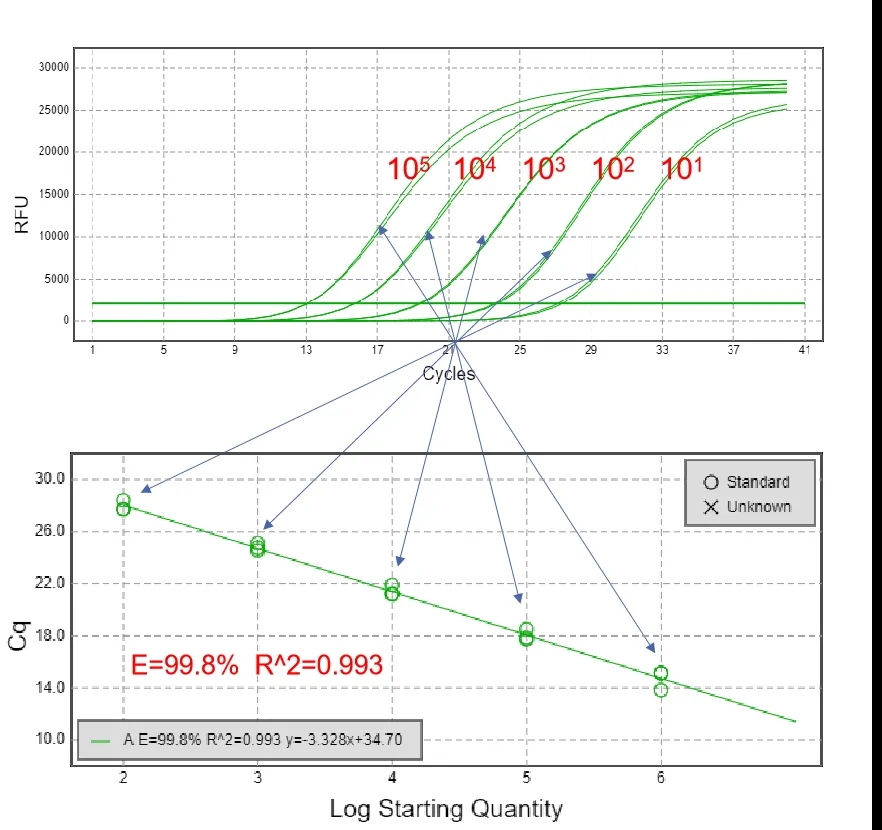
Standard curve:Usually, samples of known concentration are serially diluted and then sampled separately for fluorescence quantitative PCR to obtain a series of CT values. With the logarithm of the concentration as the horizontal coordinate and the CT value as the vertical coordinate, a curve is plotted to obtain a standard curve.